Overview
The gradient analysis for Likelihood shows the rate of change of the likelihoods of events due to the change in the likelihood of one of the threats.
In Riskion, we refer to threats, causes, hazards, and sources interchangeably. While they may have slightly different nuances depending on the context in which they are used, they serve the same purpose -- they are all threats/sources of risk (for Risk Events) or sources of opportunity (for Opportunity Events).
In our sample model, we are using the terminology "Source(s)".
 Gradient Sensitivity for the Overall Events Likelihoods
Gradient sensitivity is composed of:
- A source on the x-axis -- which can be selected from
 or a pulldown menu
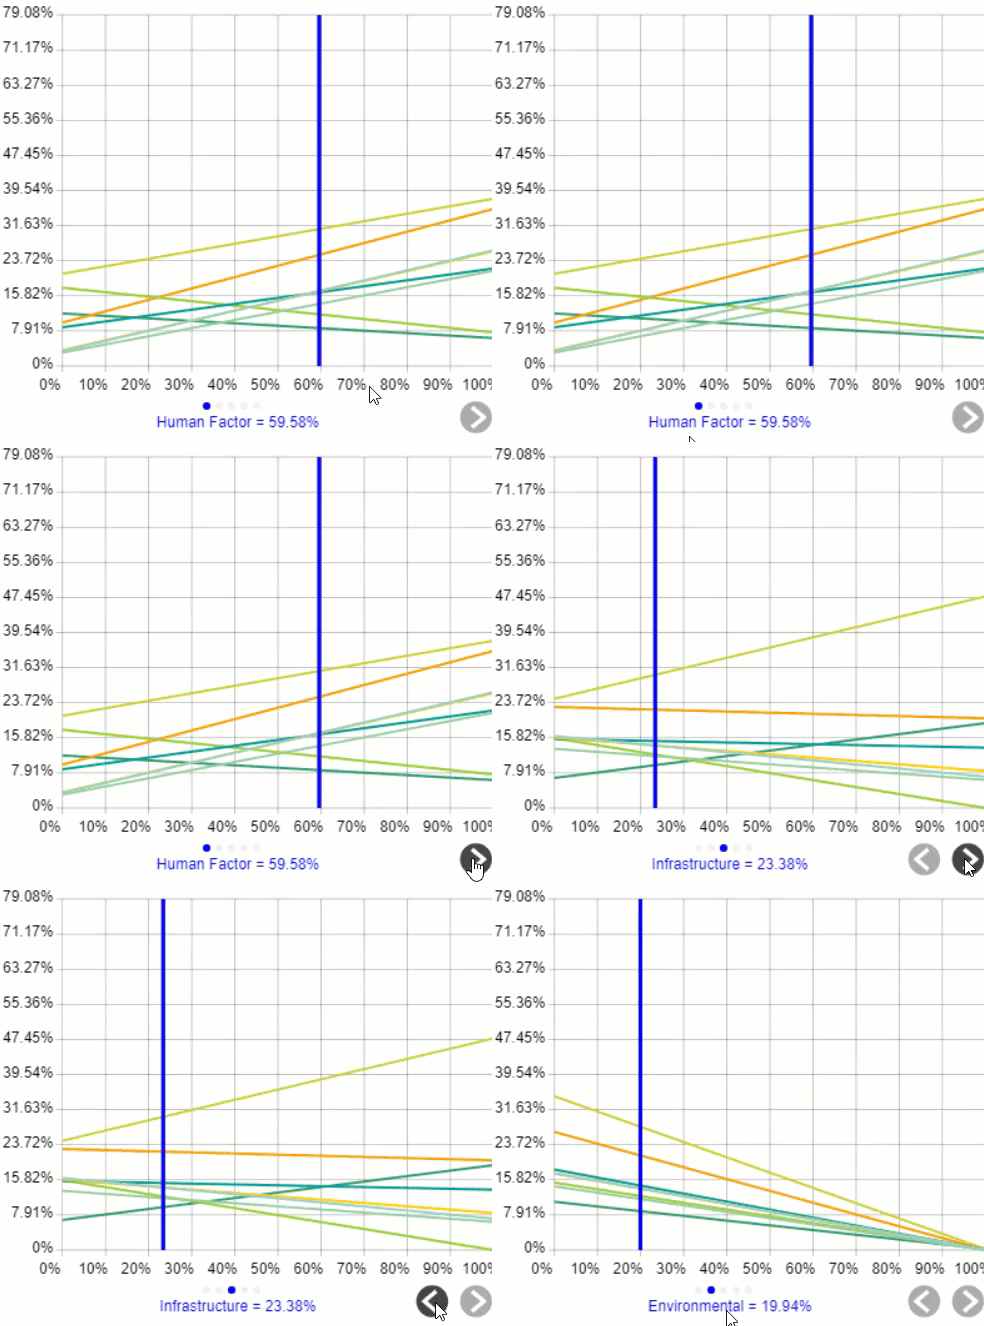
- A curve for each of the events
- A vertical blue bar representing the likelihood of the source being considered.
You can temporarily alter the relationship between the events and their sources by dragging the blue vertical bar left or right. The original impacts are represented by the vertical gray bar.

After temporarily changing the likelihoods of one or more of the sources, you can press the  reset icon.
By selecting an element in the hierarchy other than the top node, you can see the results due to this element rather than the overall results due to the "Sources" node.
 Gradient Sensitivity for the Events Likelihoods due to "Human Factor"
The gradient analysis above shows all the event likelihoods due to the selected node Human Factor.
You can show the local and global source's likelihoods on the Source Hierarchy at the right using the Local-Global buttons:

You can hide the Sources Hierarchy at the left using 
Click  to show/hide the toolbar options:

DIDN'T SEE WHAT YOU ARE LOOKING FOR? Try enabling the Advanced Mode switch at the bottom of the page, this will show the advanced options on this page.
Select Participants and Groups
You can select to display results for one participant or group using 
Clicking the  button will open a window where you can select a participant or a group.
You can use the prev and the next
  buttons to cycle through each participant or group.
Filter Events
By default, all events are displayed.

You can select to display the top or bottom 5, 10, or 25 events based on the "All Participants" group likelihoods.
The Advanced filter, allows you to select a specific number for the top N, and base it on another group or participant.

The select /deselection option, allows you to check/uncheck the events.
The filter by events attributes, filter the events base on the attributes specified on the Events page.
The show risks only / Show opportunities only are applicable for the Mixed model where events can be Risk or Opportunity.
Advanced Mode Options

When the Advanced mode is ON, you will see the advanced options of the page you are currently working on.
1. Combined Input Option (CIS)
If the Combined Input Option (CIS) is ON then results for individuals are computed by combining the likelihoods (or impacts) derived from judgments/ratings for which they had roles, with the combined results for any parts of the model where they did not have a role.

2. Apply User Priorities
If priorities (weights) have been specified for participants, you can use the "User Priorities" check box which enables you to apply or ignore these priorities in calculating the results.

3. Synthesize Events WRT top-node
This option is available on all the Sensitivity screens and can only be enabled when a non-covering node other than the top node is selected on the hierarchy tree.

Enabling this option allows to temporarily change the likelihood (or impacts) of the children of the selected node and see how these changes will affect the overall likelihood (or impacts, or risks) of the events. If this is OFF, we can then see the change of the likelihood (or impacts, or risks) of the events WRT the selected node.
 or a pulldown menu
