Overview
This page displays a similar diagram as with the Overall Bow-tie Diagram (without controls) -- but on this page, the likelihoods, impacts, and risks are calculated with controls in effect. Controls can also be viewed, selected/deselected (to be in effect), and assigned from the diagram.
 Bow-tie Diagram with controls
- Likelihood of Sources (from the bow-tie, these are the controls on the sources boxes at the left)
- Vulnerabilities of Events from Sources (from the bow-tie, these are the controls on the lines connecting the event to the sources)
- Consequences of Events to Objectives (from the bow-tie, these are the controls on the lines connecting the event to the objectives)
The bow-time diagram for the Event "Failed Integration with Failure Monitoring System Network" from the Overall Source with controls is displayed below.

The selected Event is displayed at the center of the diagram (circle). The event background color varies based on the event's %risk.
The Sources of the selected event are on the left side of the diagram (green boxes).
The Objectives of the selected Event are on the right (blue boxes).
The small boxes represent the Controls. The value inside the control boxes is the effectiveness of the control. Controls that are in effect have a white background color, while those that are not in effect are grey-out. Controls to be in effect are selected manually or by optimization.
You can also view and analyze the following information:
- L - Likelihood of Sources
- V - Vulnerabilities of events to sources
- C - Consequences of Events on Objectives
- P - Priority of Events on Objectives
Focusing on the first source and objective on the diagram:

- The Likelihood (L) of the Source "Inadequate Trained Staff" is 6.24% (overall or global likelihood)
- The Vulnerability (V) of the Event "Failed Integration with Future Monitoring System Network" to the source "Inadequately Trained Staff" is 0.66%
- The Consequence (C) of the Event "Failed Integration with Future Monitoring System Network" on the Objective "Loss of Company Reputation" is 46.70%
- The Priority (P) of Objective "Loss of Company Reputation" is 4.28% (overall or global impact)
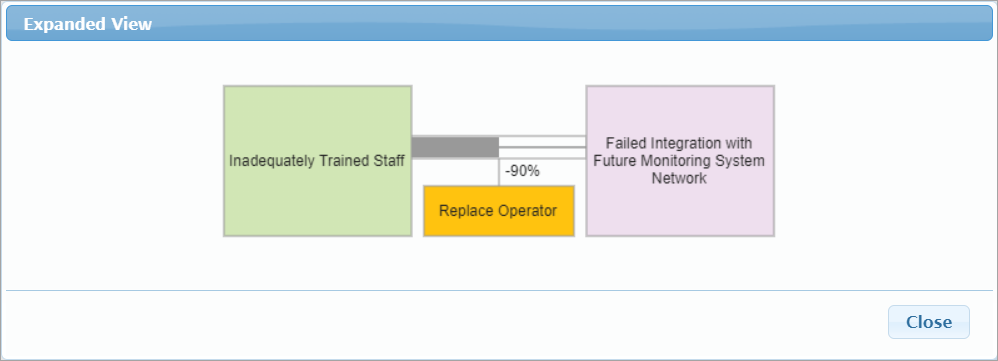
From the above diagram, we can see that there are 5 potential controls and only 1 is in effect as represented on the box with the value 0.900.

Hovering on it will show the control name, "Replace Operator" as shown above.
The "Replace Operator" with the effectiveness of 0.9 is a control that mitigates the Vulnerability of the Event "Failed Integration with Future Monitoring System Network" From the source "Inadequately Trained Staff". With this, [V:0.66%] is a mitigated vulnerability.
You can uncheck the "With Controls" checkbox on the toolbar to see the results without controls.

Here we see that the Vulnerability [V] of the event to the source without control is 6.64%. When the "Replace Operator" control is in effect, the Vulnerability is reduced by 5.976.
= Event Vulnerability without control * Control Effectiveness
= 6.64 * 0.9
= 5.976 %
Finally, the resulting Event Vulnerability with control is 6.64 % - 5.976% = 0.66%.
The Likelihood of the event to a given source (L*V), and the Impact of the event (C*P) on a given objective are shown on the connecting lines to the source/objective boxes:

- The Likelihood of the Event "Failed Integration with Future Monitoring System Network" to the source "Inadequately Trained Staff" with control is 0.04% (this is 0.41% without control).
- The Impact of the Event "Failed Integration with Future Monitoring System Network" on the Objective "Loss of Company Reputation" is 2.0% (since there is no control is in effect for this event given the objective, the impact remains 2.0%)
The summation of likelihoods (∑ "L*V") of the event to each source is the Overall Likelihood of the event, and the summation of impacts (∑ "C*P") of the event on each objective is the Overall Impact of the event.

The event "Failed Integration with Future Monitoring System Network" has Overall Likelihood and Impact 10.11% and 6.25% respectively when controls are in effect.
The Overall Event Risk is then computed by Likelihoods * Impacts, 10.11% * 6.25% = 0.63%
You can uncheck the  checkbox to compare results when no controls are in effect and see how the likelihoods, impacts, and risk reduced as controls are in effect.
You can select another Event to analyze from the Events list at the left:

Manage Controls from the Bow-tie Diagram
You can select/deselect a control to be in effect by double-clicking a control.
Alternatively, you can right-click on a control box to see the select/deselect options together with other functionality.

- Edit Control - open to update the control name, cost, and categories.
- Edit Description - open a rich text editor to edit the control description
- Evaluation Control Effectiveness - redirect to evaluation step specific to the control selected
- Delete control - delete the control
Hovering on the Source box, and the connecting line from Event to Source and Event to Objective will show a hamburger menu.

- View Controls - open a modal listing all the potential controls for the specific source, event from a source, or event to an objective. The effectiveness of the control and is active (YES if selected, NO if not) is also displayed.

- Expanded View - shows a diagram of the elements (source, event, objective, control)
- New Control - add a new control
- Select Controls - list all the available controls for the specific control type (for sources, events to source, or events to objectives). Here you can select potential control of given elements involved.
- Edit Controls - redirect to the Identify Controls page
- Remove Contribution

Available Controls
Clicking Available Controls will open a modal listing all the identified potential controls.

Controls that are "checked" means that the control can be in effect or selected (manually or by optimization)
Controls that are "unchecked" mean that the control is disabled and can't be in effect or selected.
The "Available controls" option is just similar to the "Disabled" column on the Identify controls grid -- disabled controls are unavailable for selection for controls to be in effect.
If control is un-available, the box of that control showing its effectiveness is hidden on the bow-tie diagram
When there are un-available controls, the button will have an exclamation mark
Select Participant or Group
The bow-tie for the "All Participants" group is displayed by default. By selecting from the "Participants and Groups" dropdown, you can display the bow-tie analysis for another participants or group:

Define Event Color (Region)
Default colors are already provided for the events on the diagram based on the event's %risk.
You can change this by clicking 

Here you can specify the limits: Rh (risk high) and Rl (risk low) both for percentage or monetary.
Given the limits, you can specify the 3 regions/colors:
- High Risk
- Mid (in-between) Risk
- Low Risk
Export Bow-tie to Excel or Image Format
Click  to export the bowtie into a .xlsx file.
Click  link to download the diagram as an image file (.jpeg)
Show Monetary Values

You can show the Monetary Values for Impacts and Risks.
Clicking  will open a modal where you can specify the monetary values.

Simulated vs Computed Event Likelihoods, Impacts, and Risks (Flaw of Averages)
The risk of an event is the product of the event's likelihood and impact. However, the computed likelihood of an event may depend on the event being caused by more than one threat. If these threats are not mutually exclusive, then the computed likelihood, based on the occurrence of the event from several can exceed the actual likelihood. If in the real world an event takes place due to one threat, it is irrelevant that it would have also occurred due to another threat had the first one not caused the event. This 'if' condition is a non-linearity in computation. To arrive at the actual likelihood of an event, we can use simulations that will avoid the 'double counting'.
Similarly, an objective that suffers consequences from one event, may also suffer consequences from other events. The consequences can be cumulative but they cannot exceed the entire value of the objective so that this is another non-linearity that can be addressed with simulation.
Riskion has an option to show simulated and computed results.
Simulated results are displayed by default; unchecking the Simulated checkbox displays the calculated results.

If all events have at most one threat, or all threats are mutually exclusive, then the computed and simulated event likelihoods will be the same -- but this is rarely the case.
If each objective has losses due to only one event, then the computed and simulated impacts will be the same -- but this is rarely the case.
Preferences
Click the  button to open the display and simulation settings modal.

- Events Numbers - select from ID, Inder, or Rank
- Display Settings
- Consequences simulation mode: Diluted or Undiluted
- WRT calculation (applicable only when a lower node is selected)
- Show Total Risk - show hide the Total Risk below the grid for Diluted
- Decimals
- Show cents of Monetary Values
- Simulation Settings
- Number of trials
- Seed
- Keep Seed
- User Source Groups
- User Event Groups
